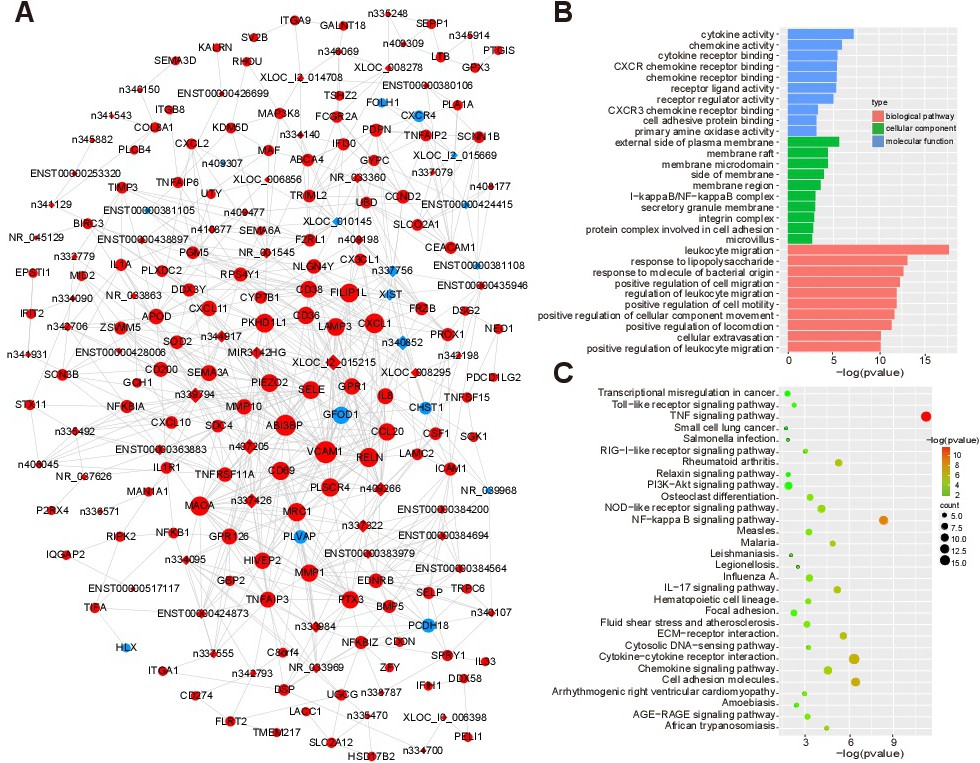
Fig. 3. Coexpression network of 72 differentially expressed lncRNAs and 132 interacting differentially expressed mRNAs with GO and KEGG analysis results. Coexpression network (A) of 72 lncRNAs and 132 interacting mRNAs. The diamonds represent lncRNAs, and the circles represent their correlated mRNAs. Blue dots and red dots indicate downregulated and upregulated lncRNAs and mRNAs. GO enrichment analysis (B) and KEGG enrichment analysis (C) of the 132 differentially expressed mRNAs (p<0.05).